
DATA DISPUTE
Data is easy to manipulate. Data is almost always used to make an argument, and therefore is usually skewed one way or another. Data analysts make data work to their advantage and can make correlation look like causation. Just think about how many people thought 5G networks caused coronavirus. A definite correlation, but causation? Think again.
In this recent venture into data analysis, I took arbitrary, unrelated data and gave it purpose. This required me to make many assumptions and force data to fit together, when in reality there is very little probability that the data had any effect on each other.
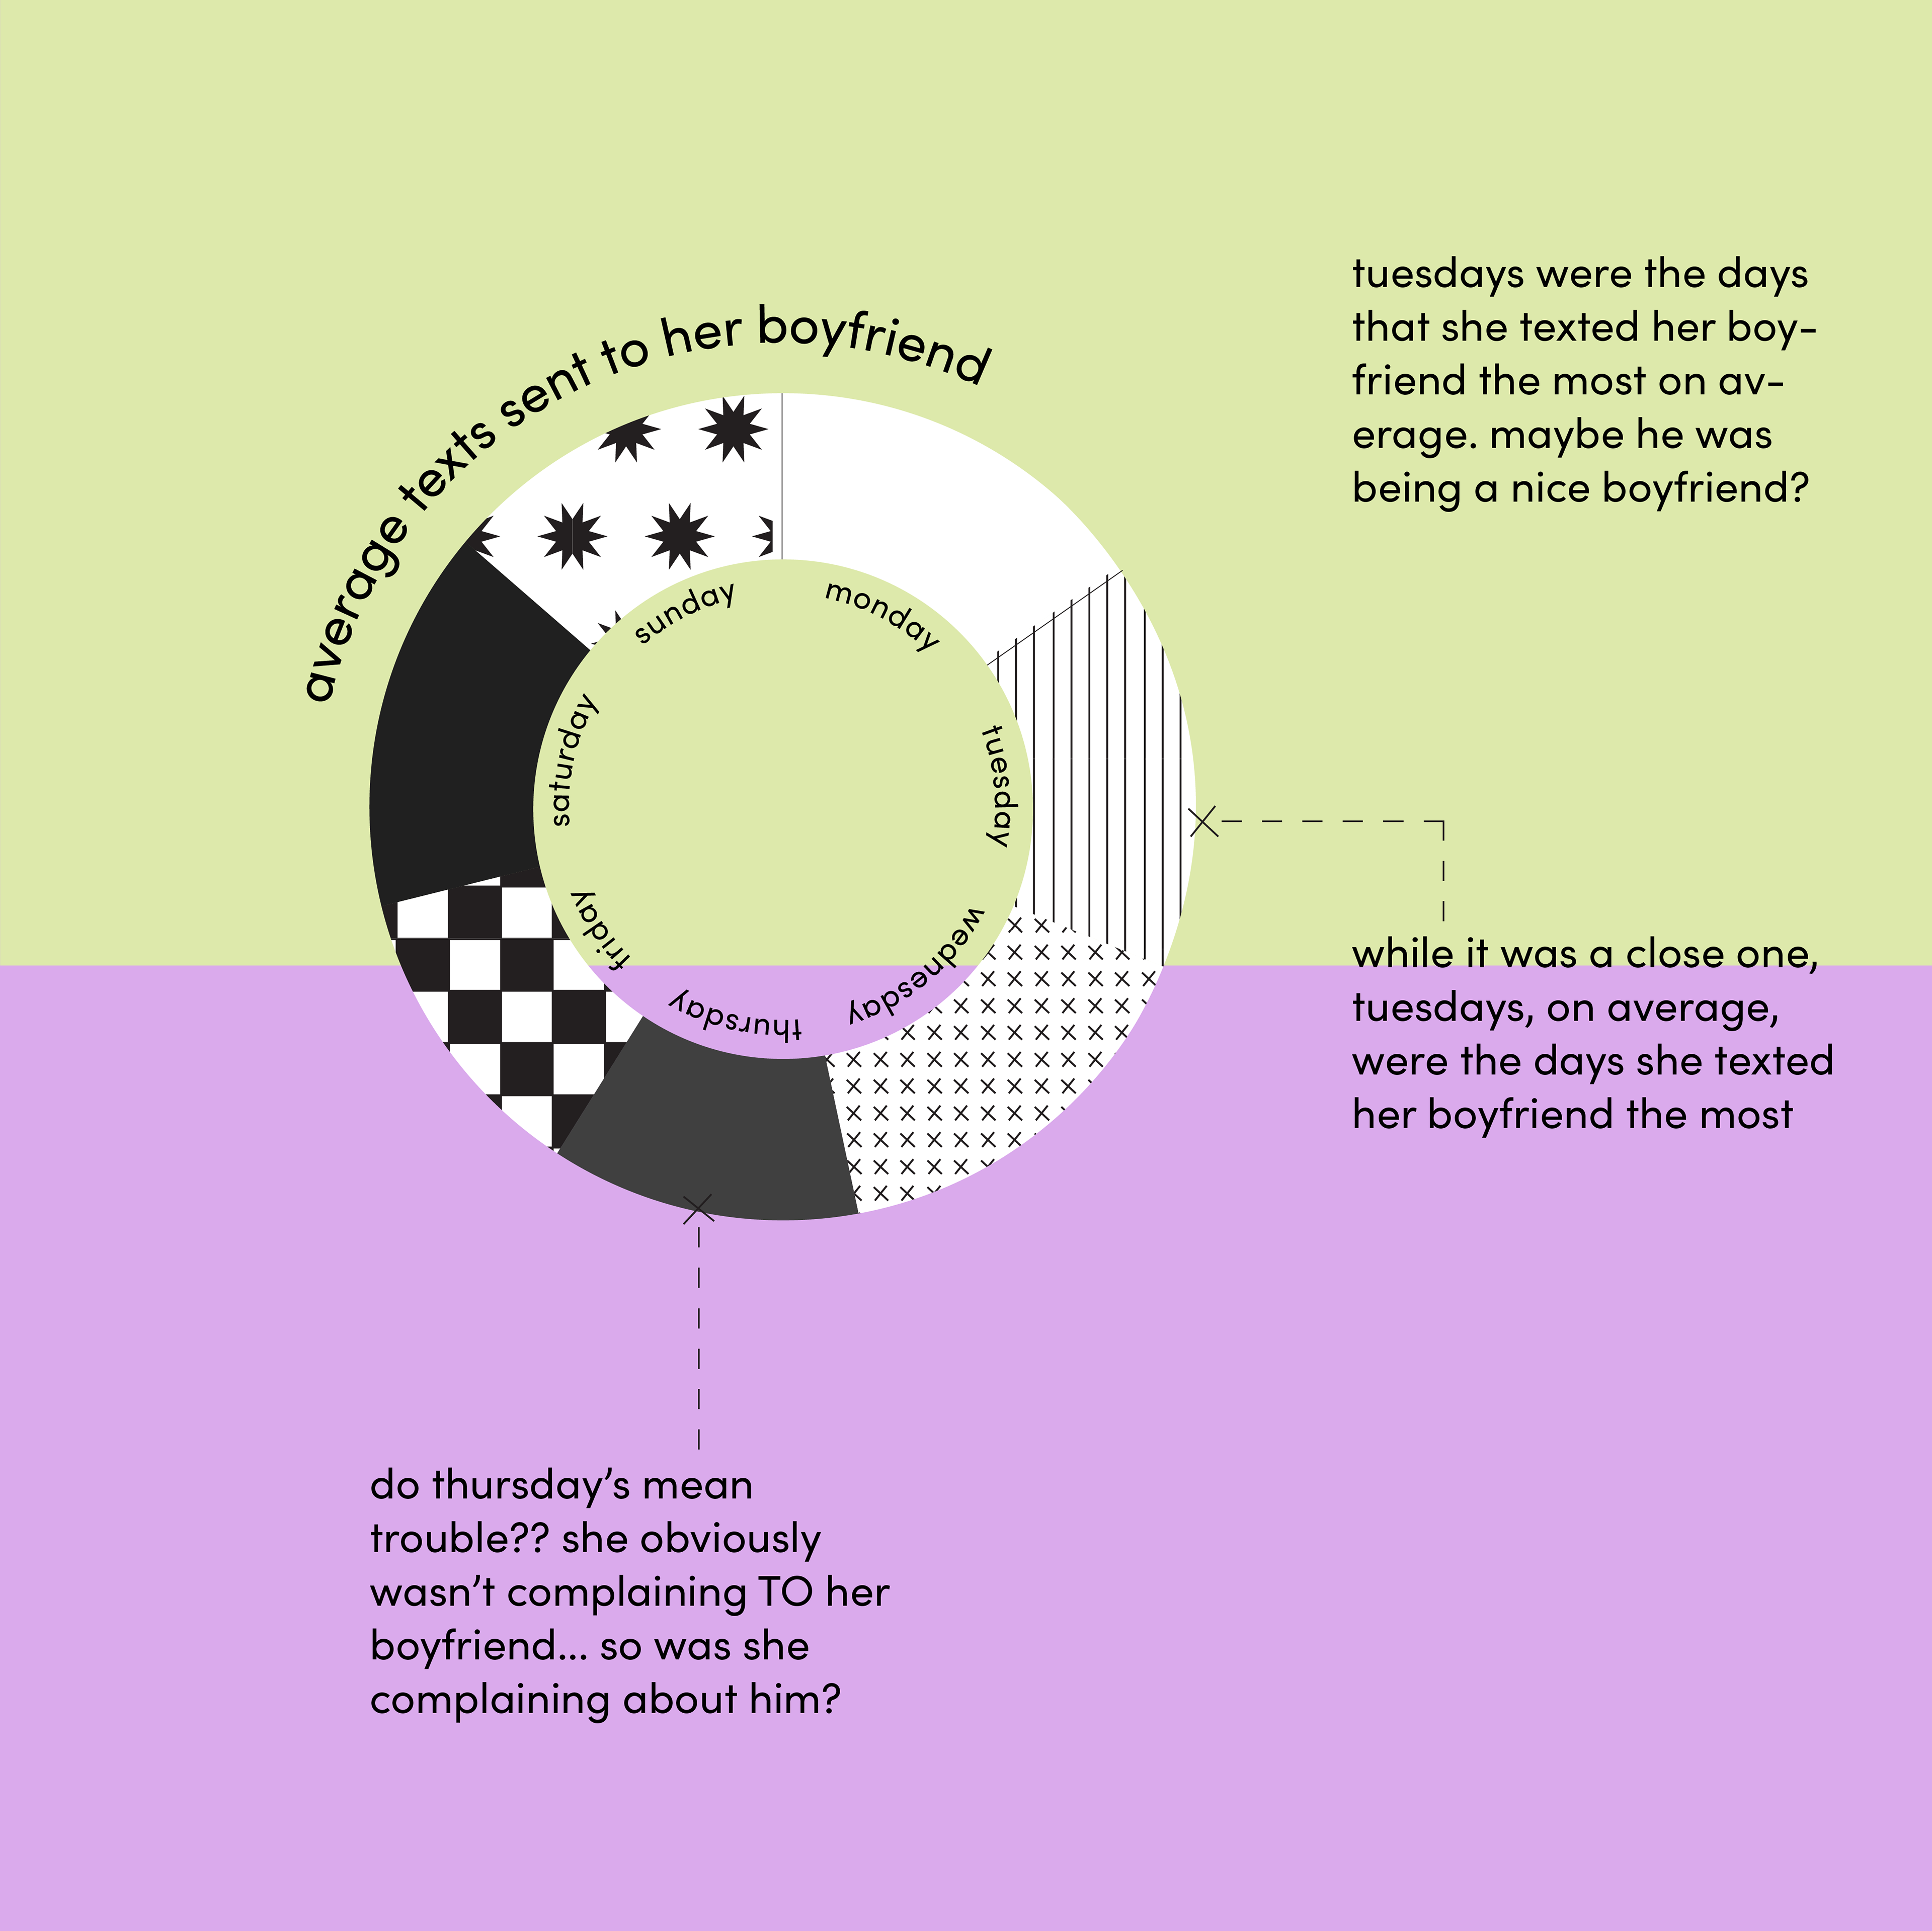
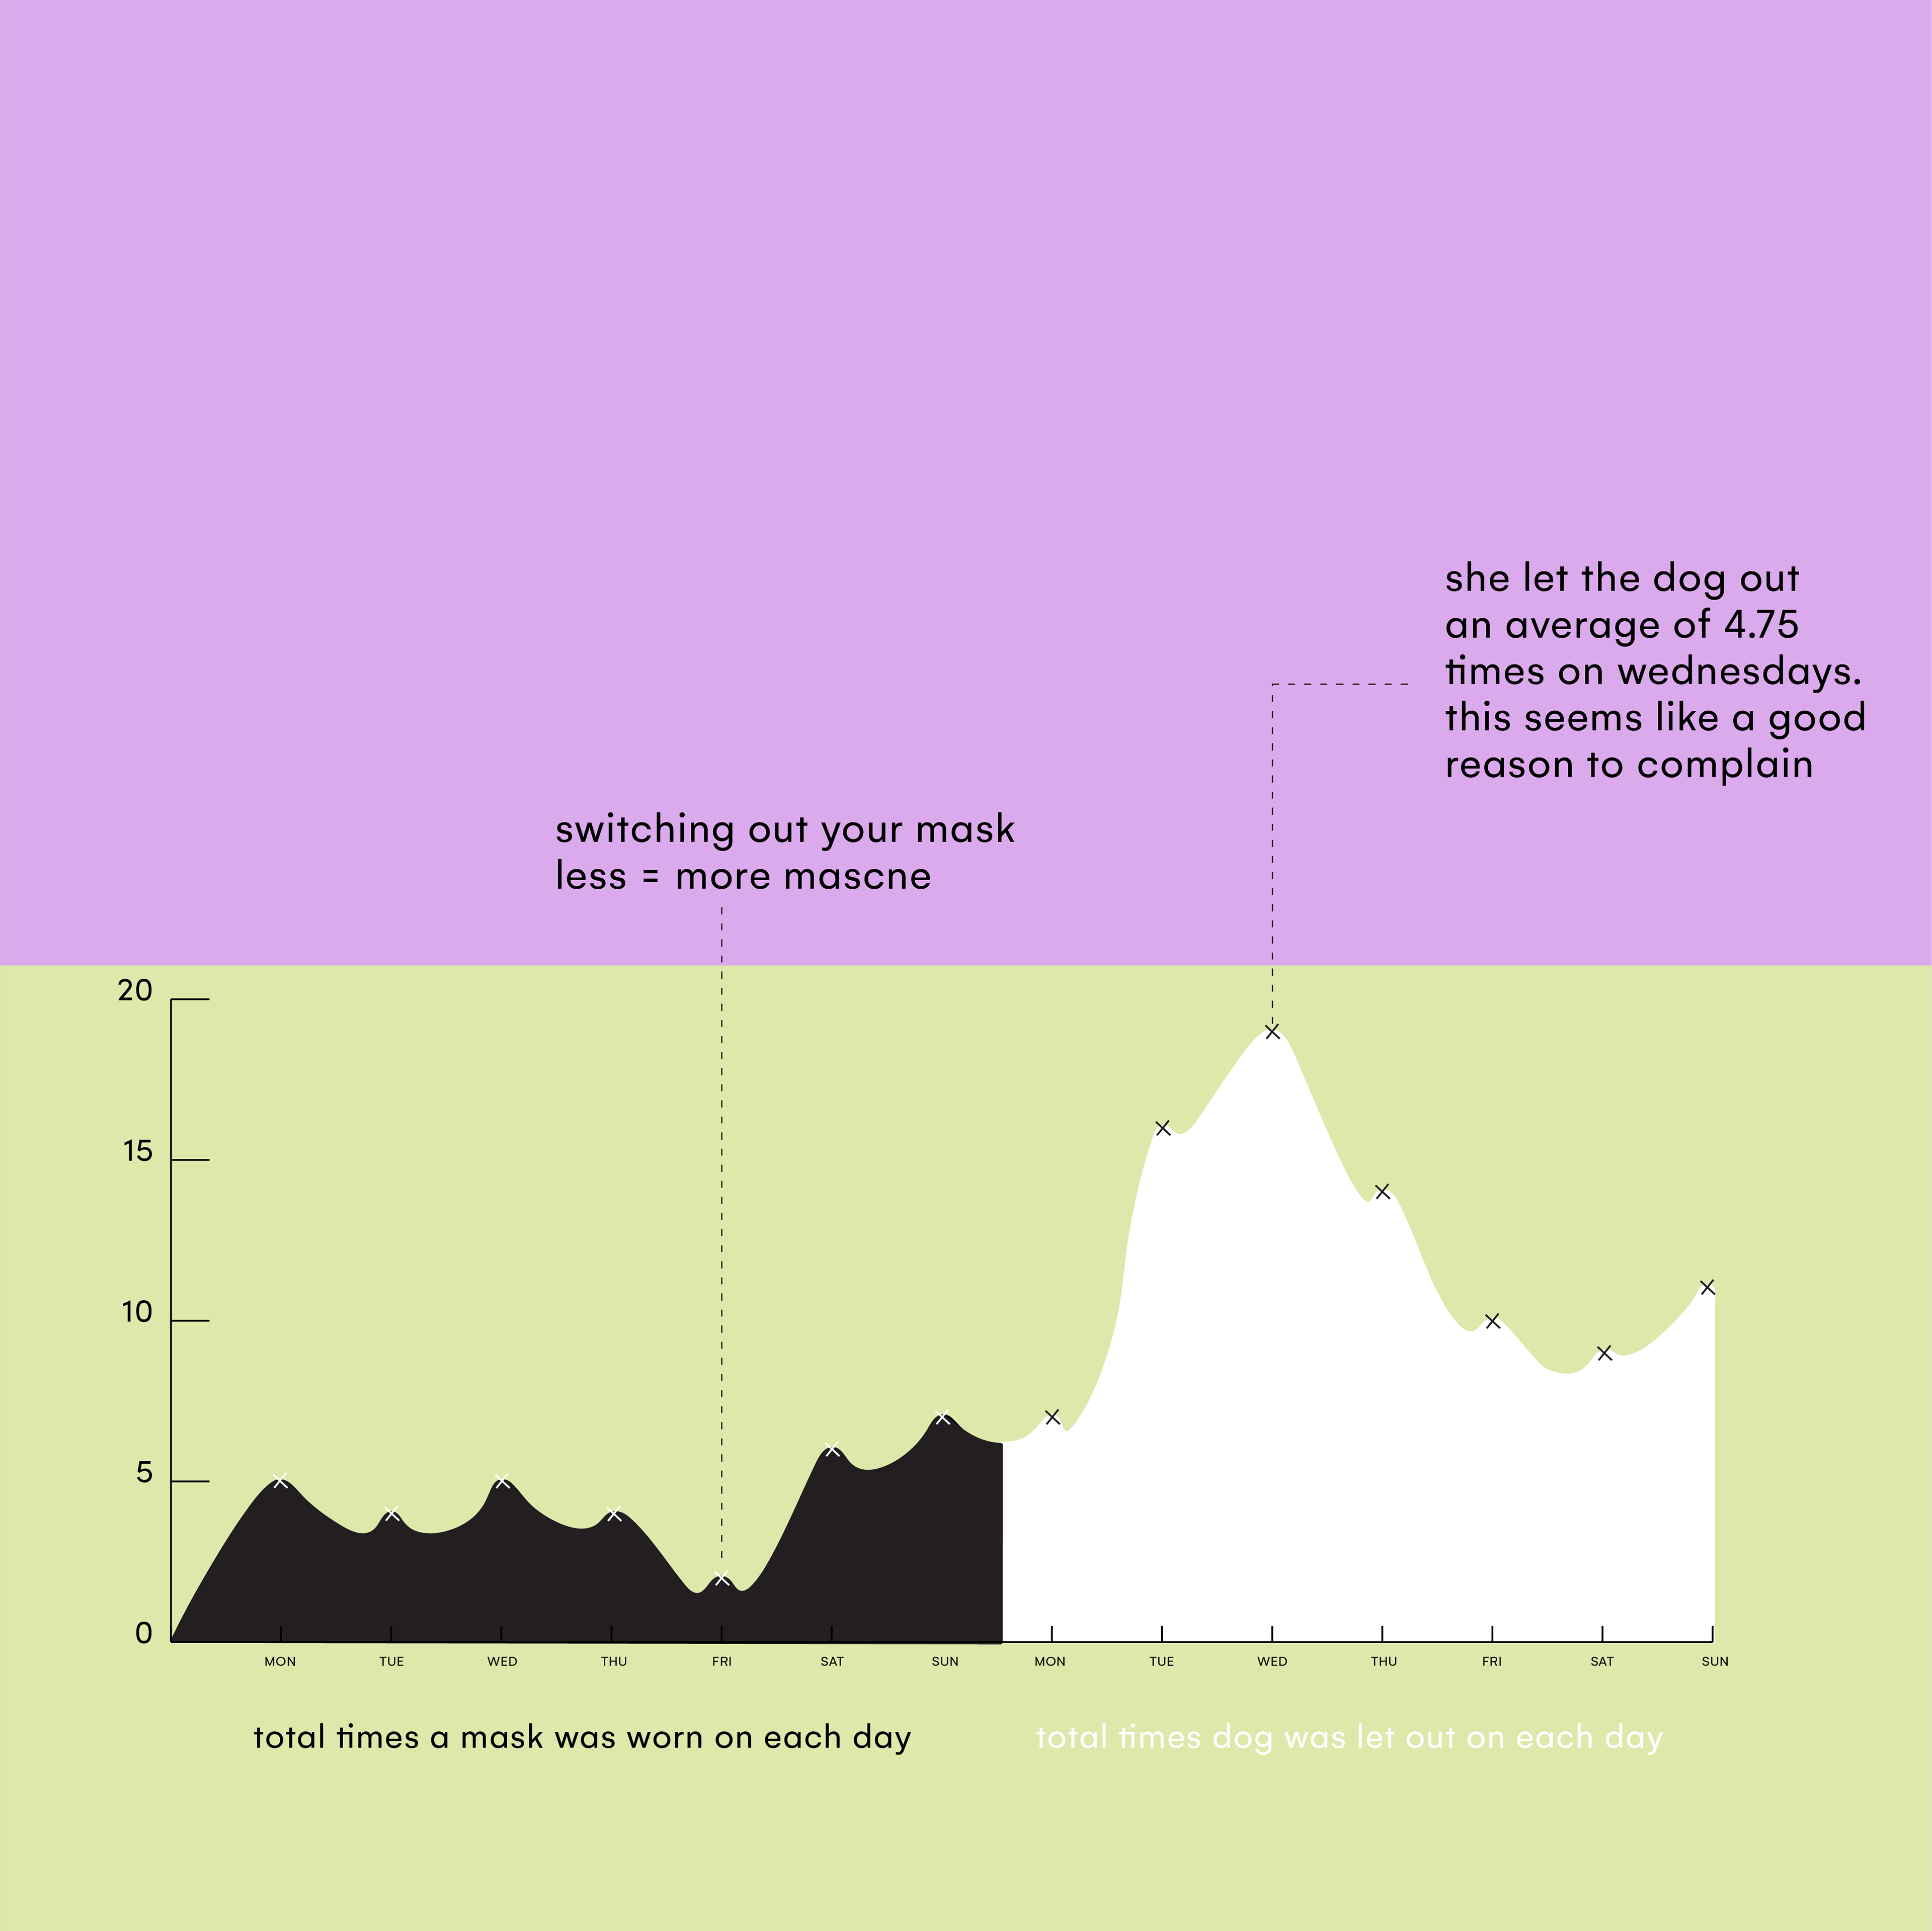
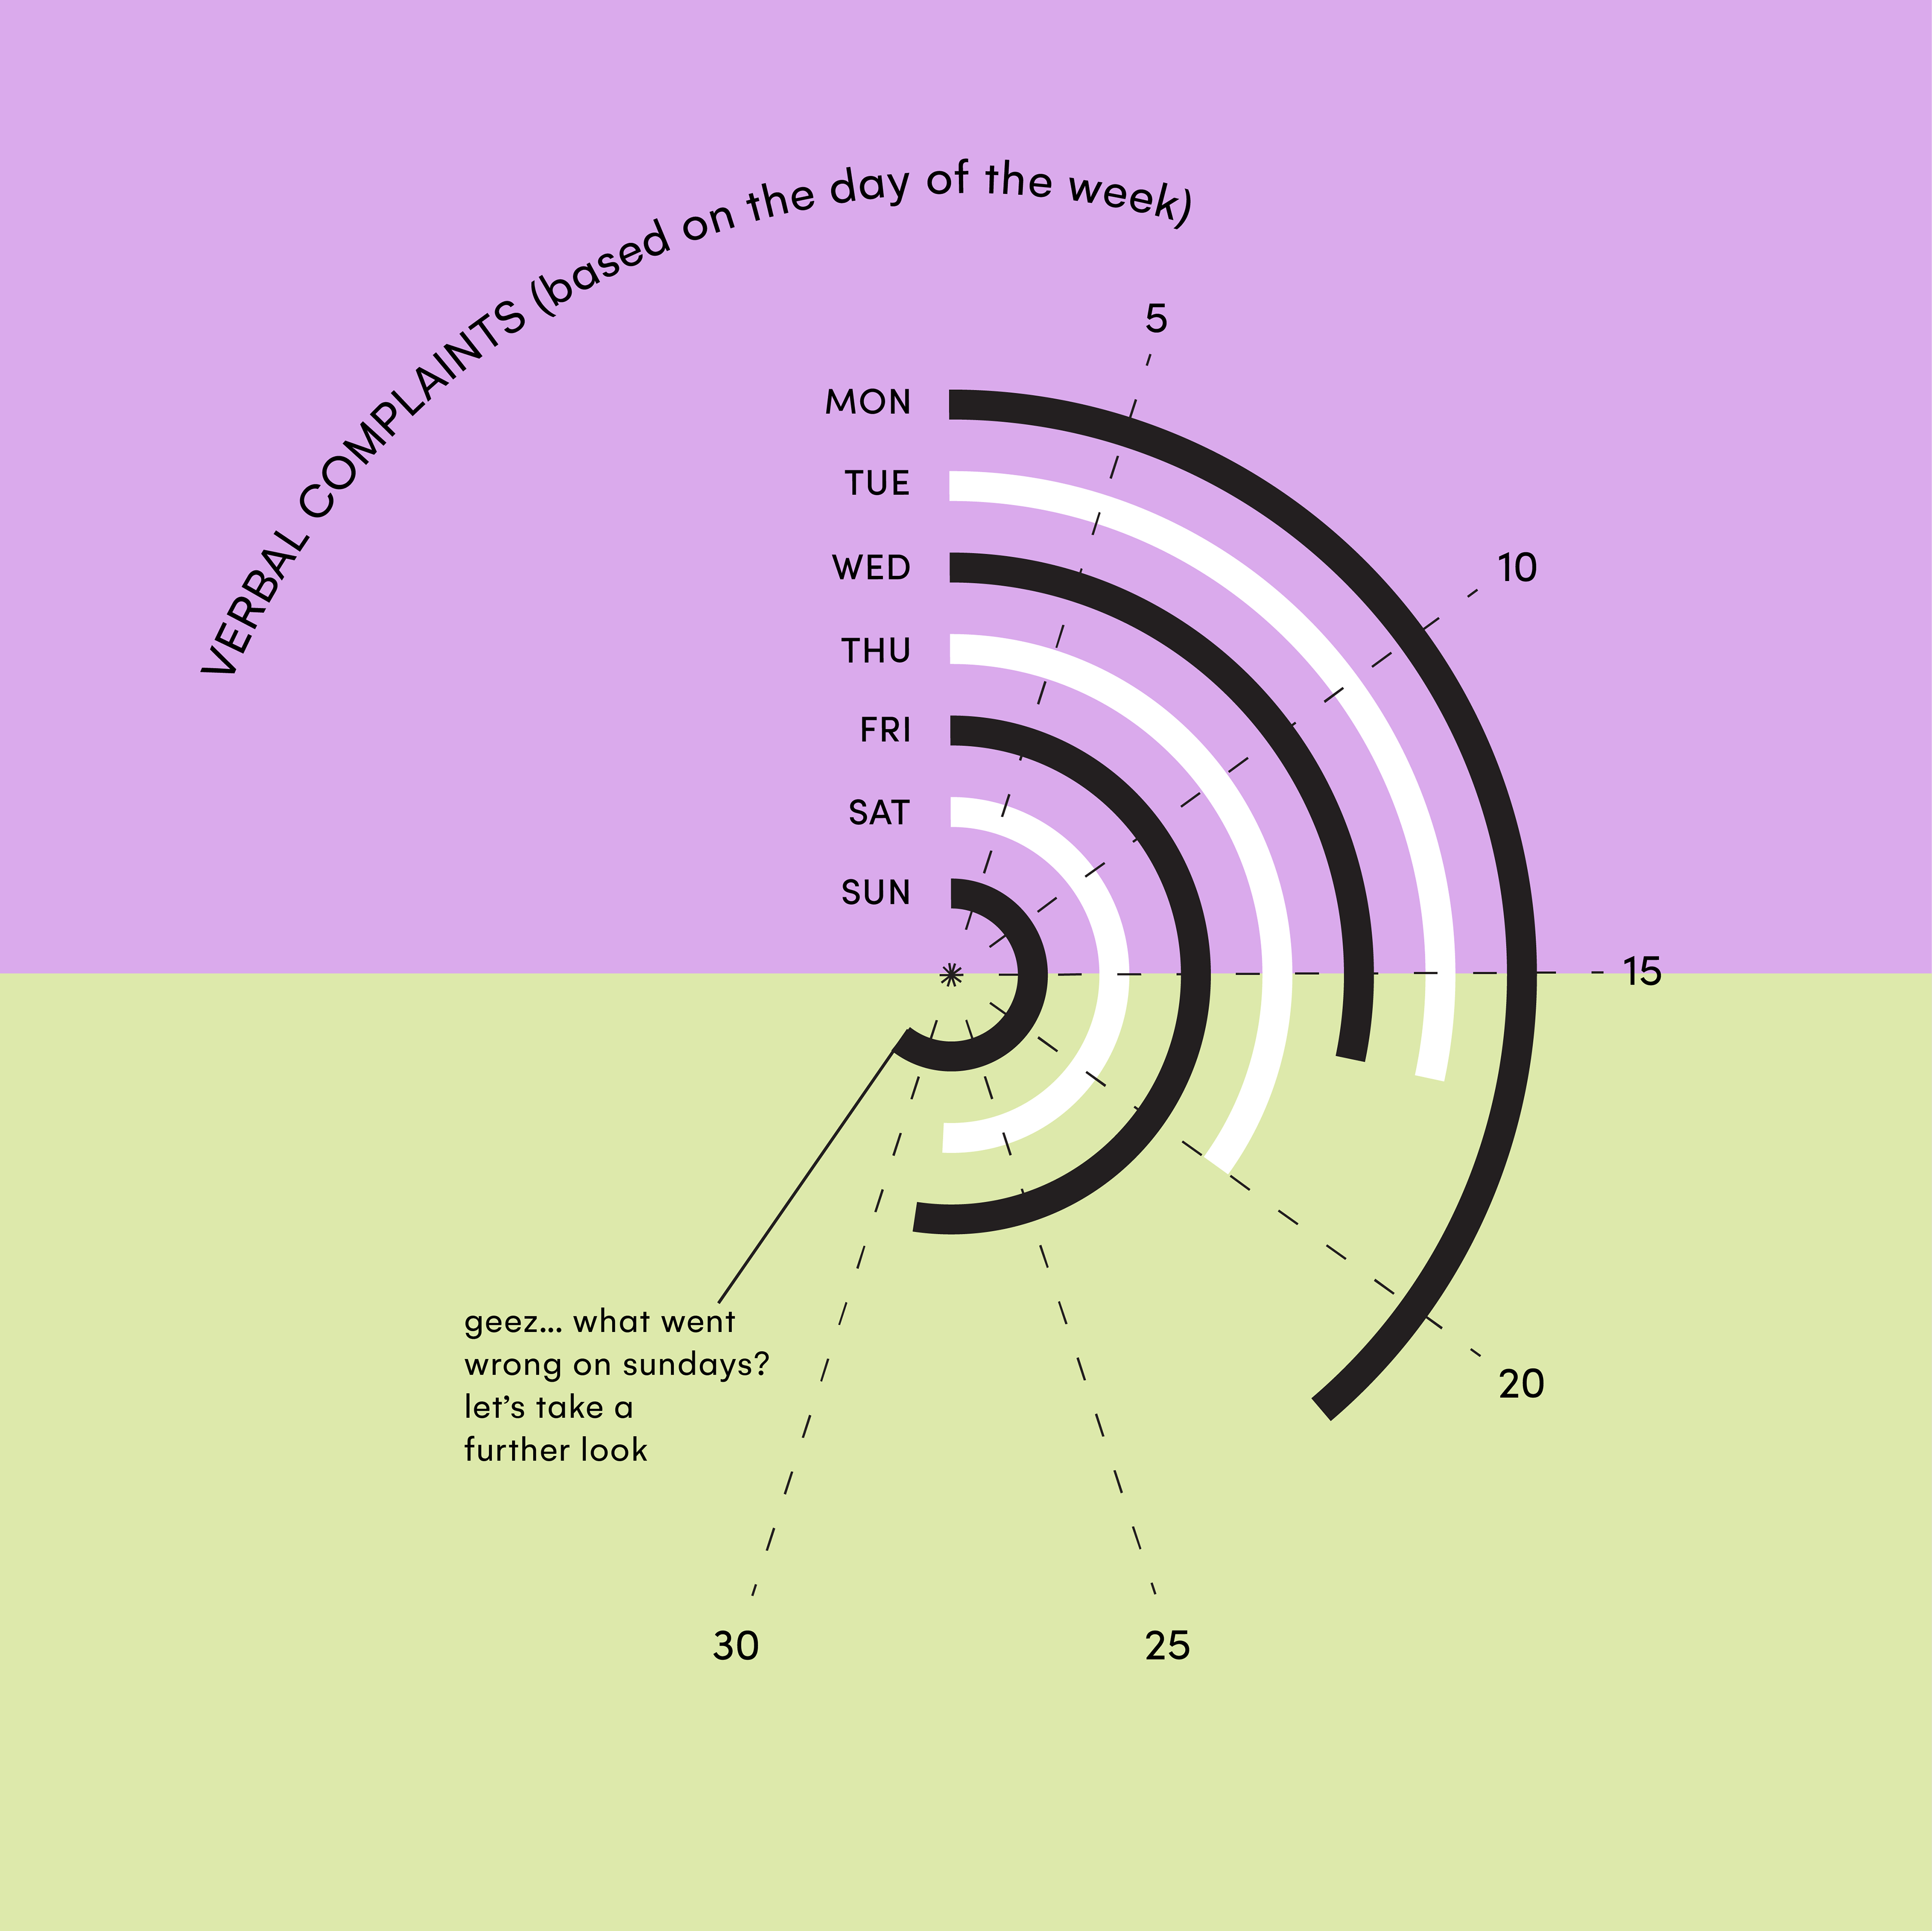
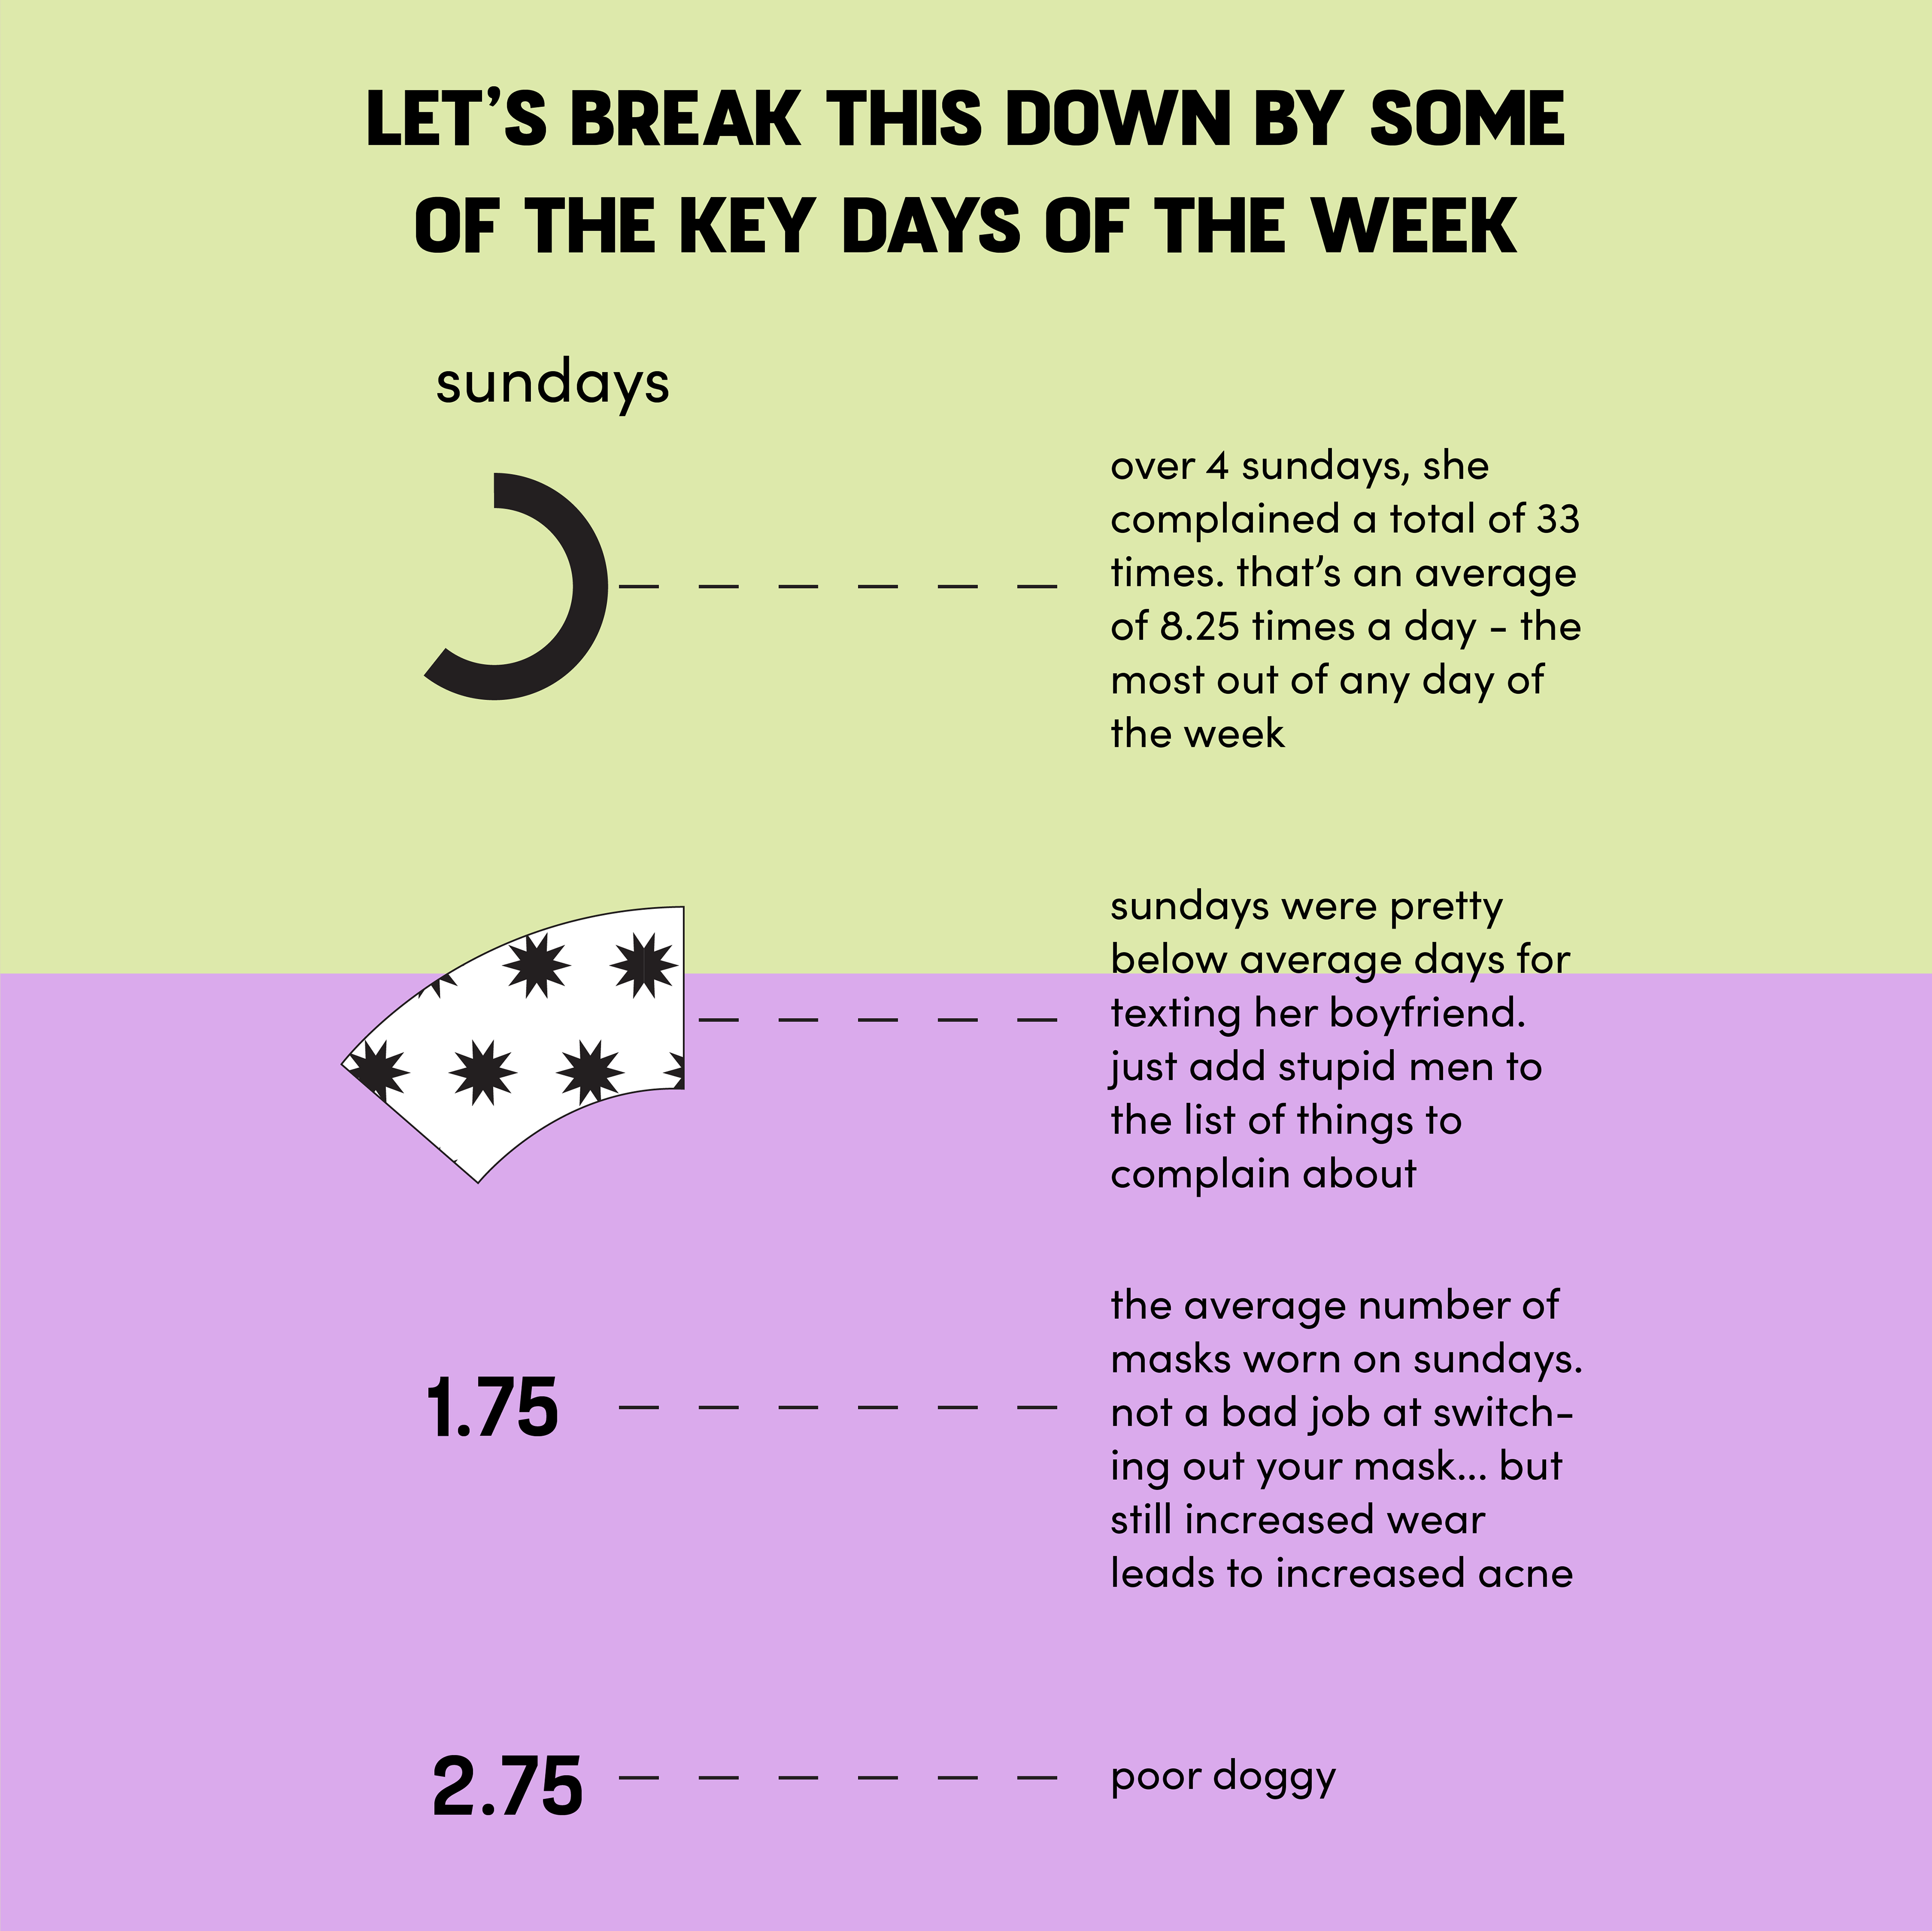
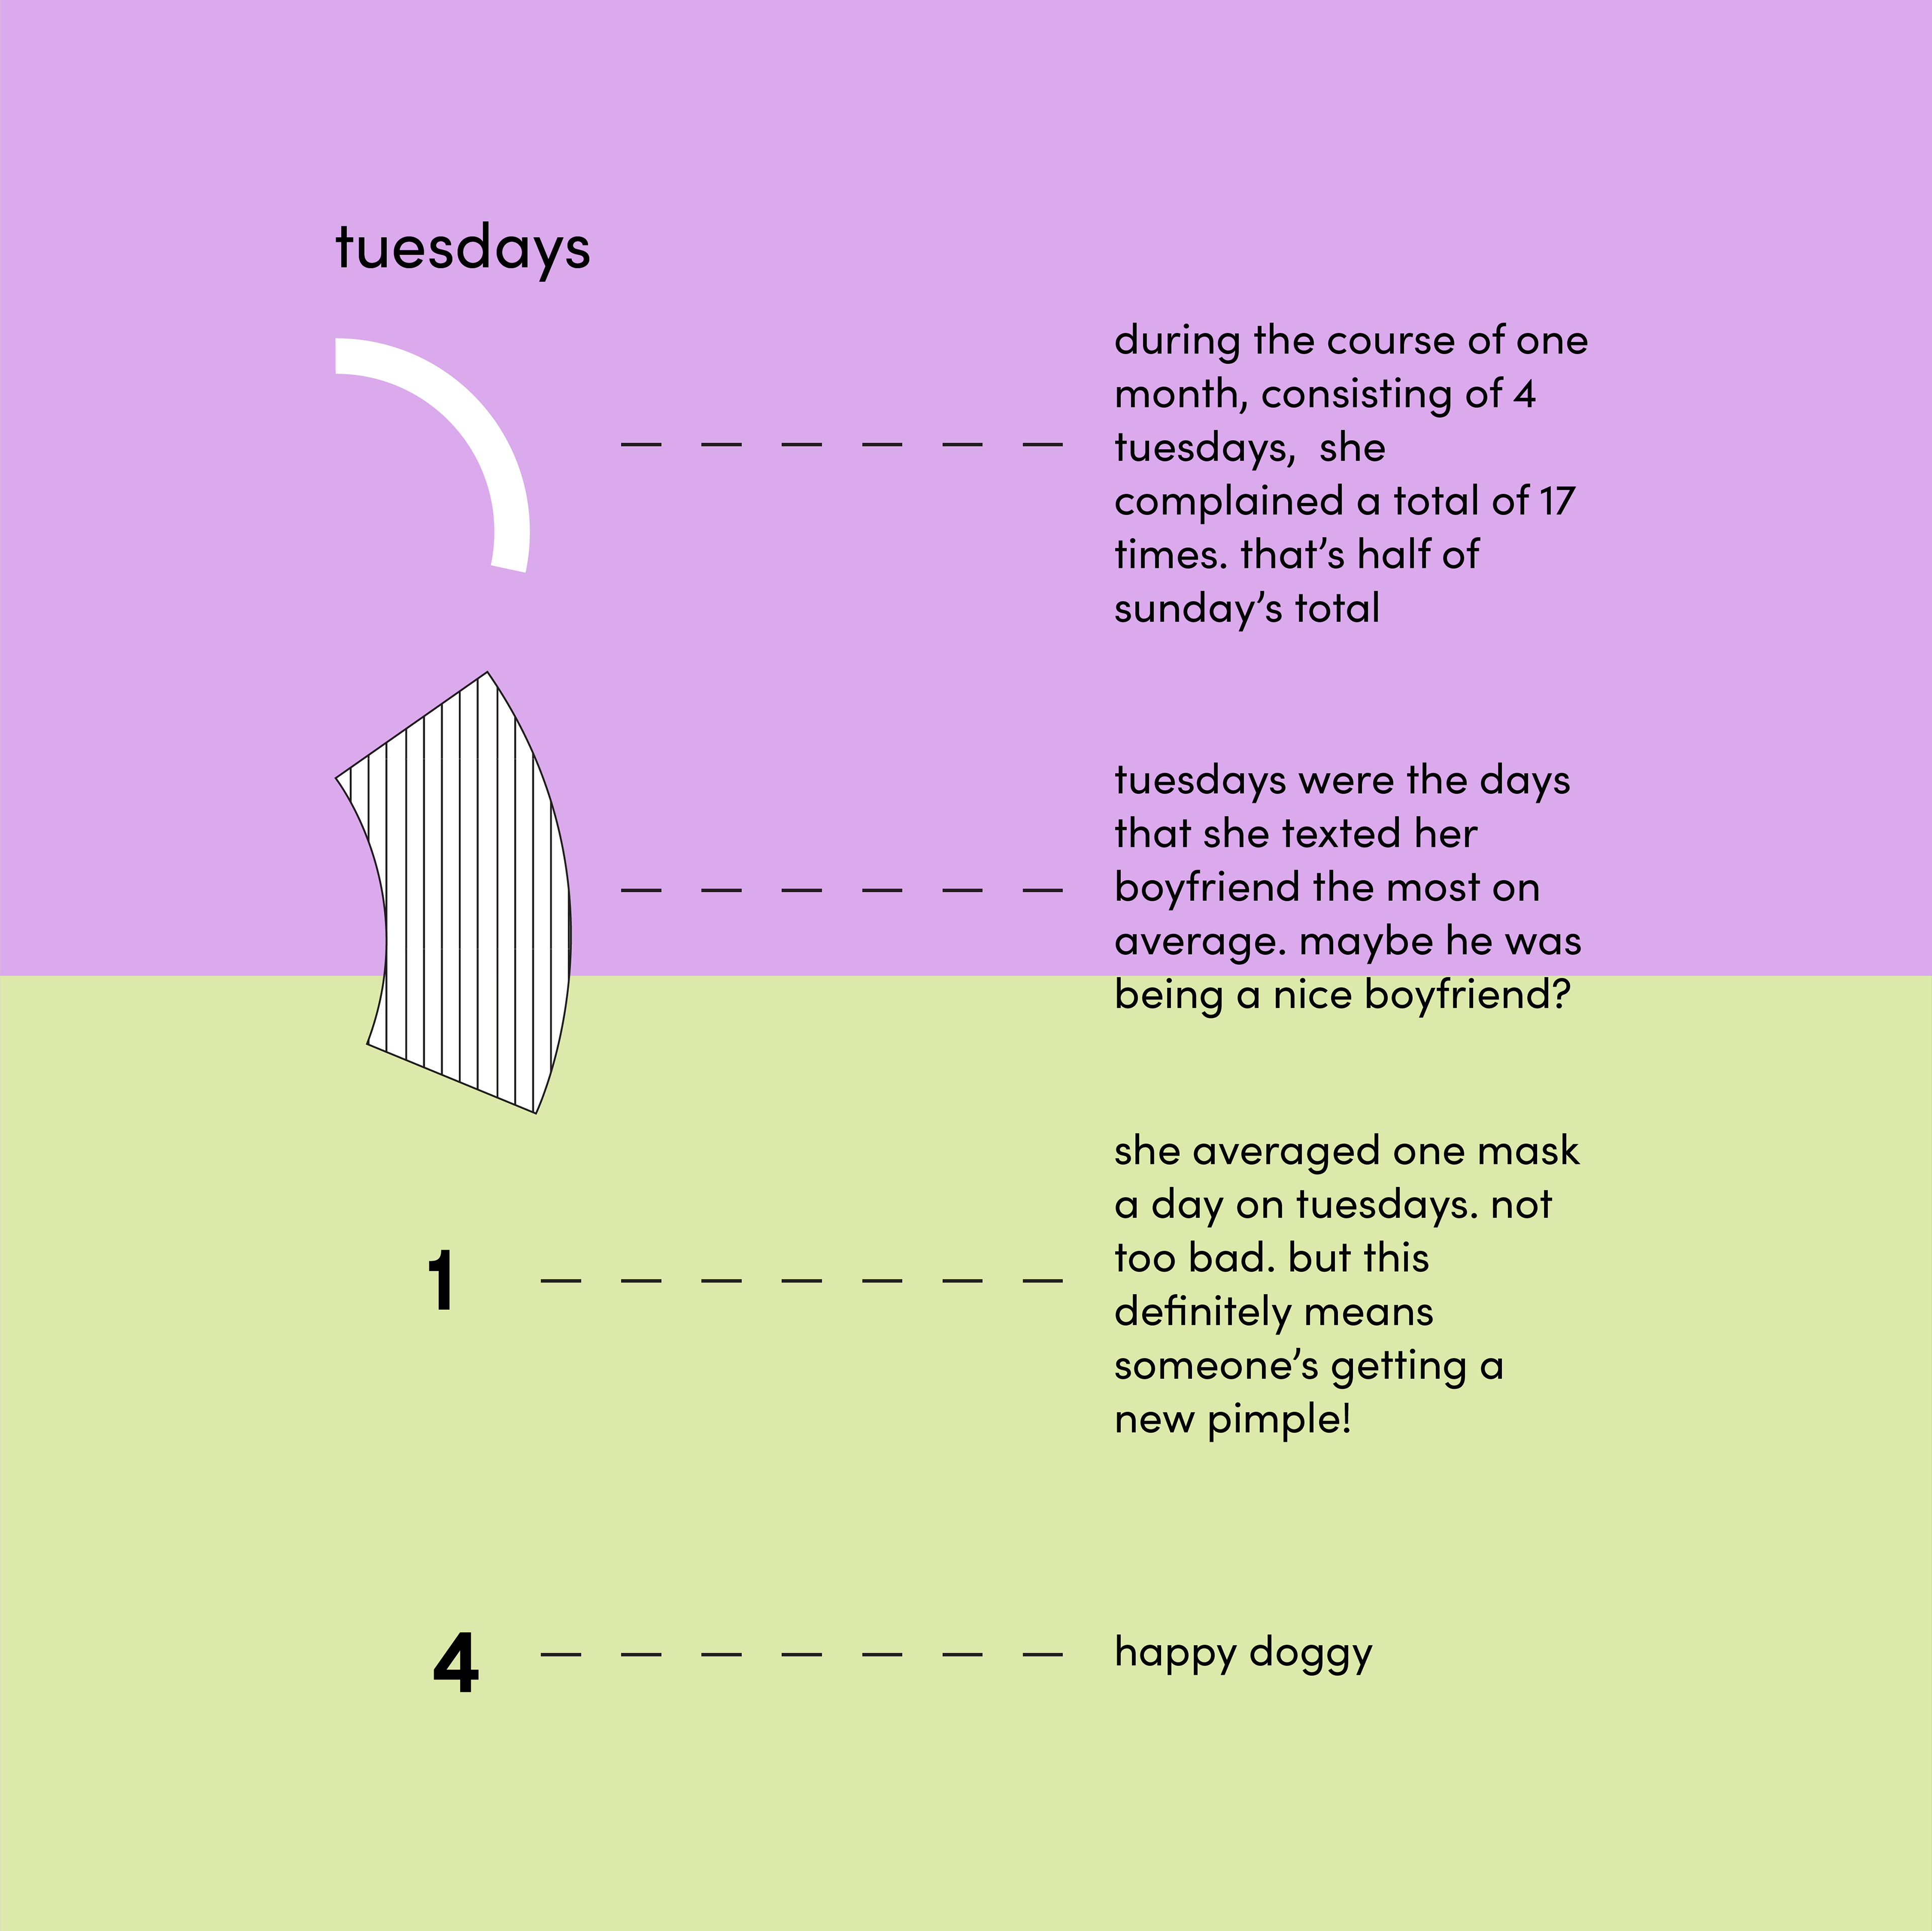
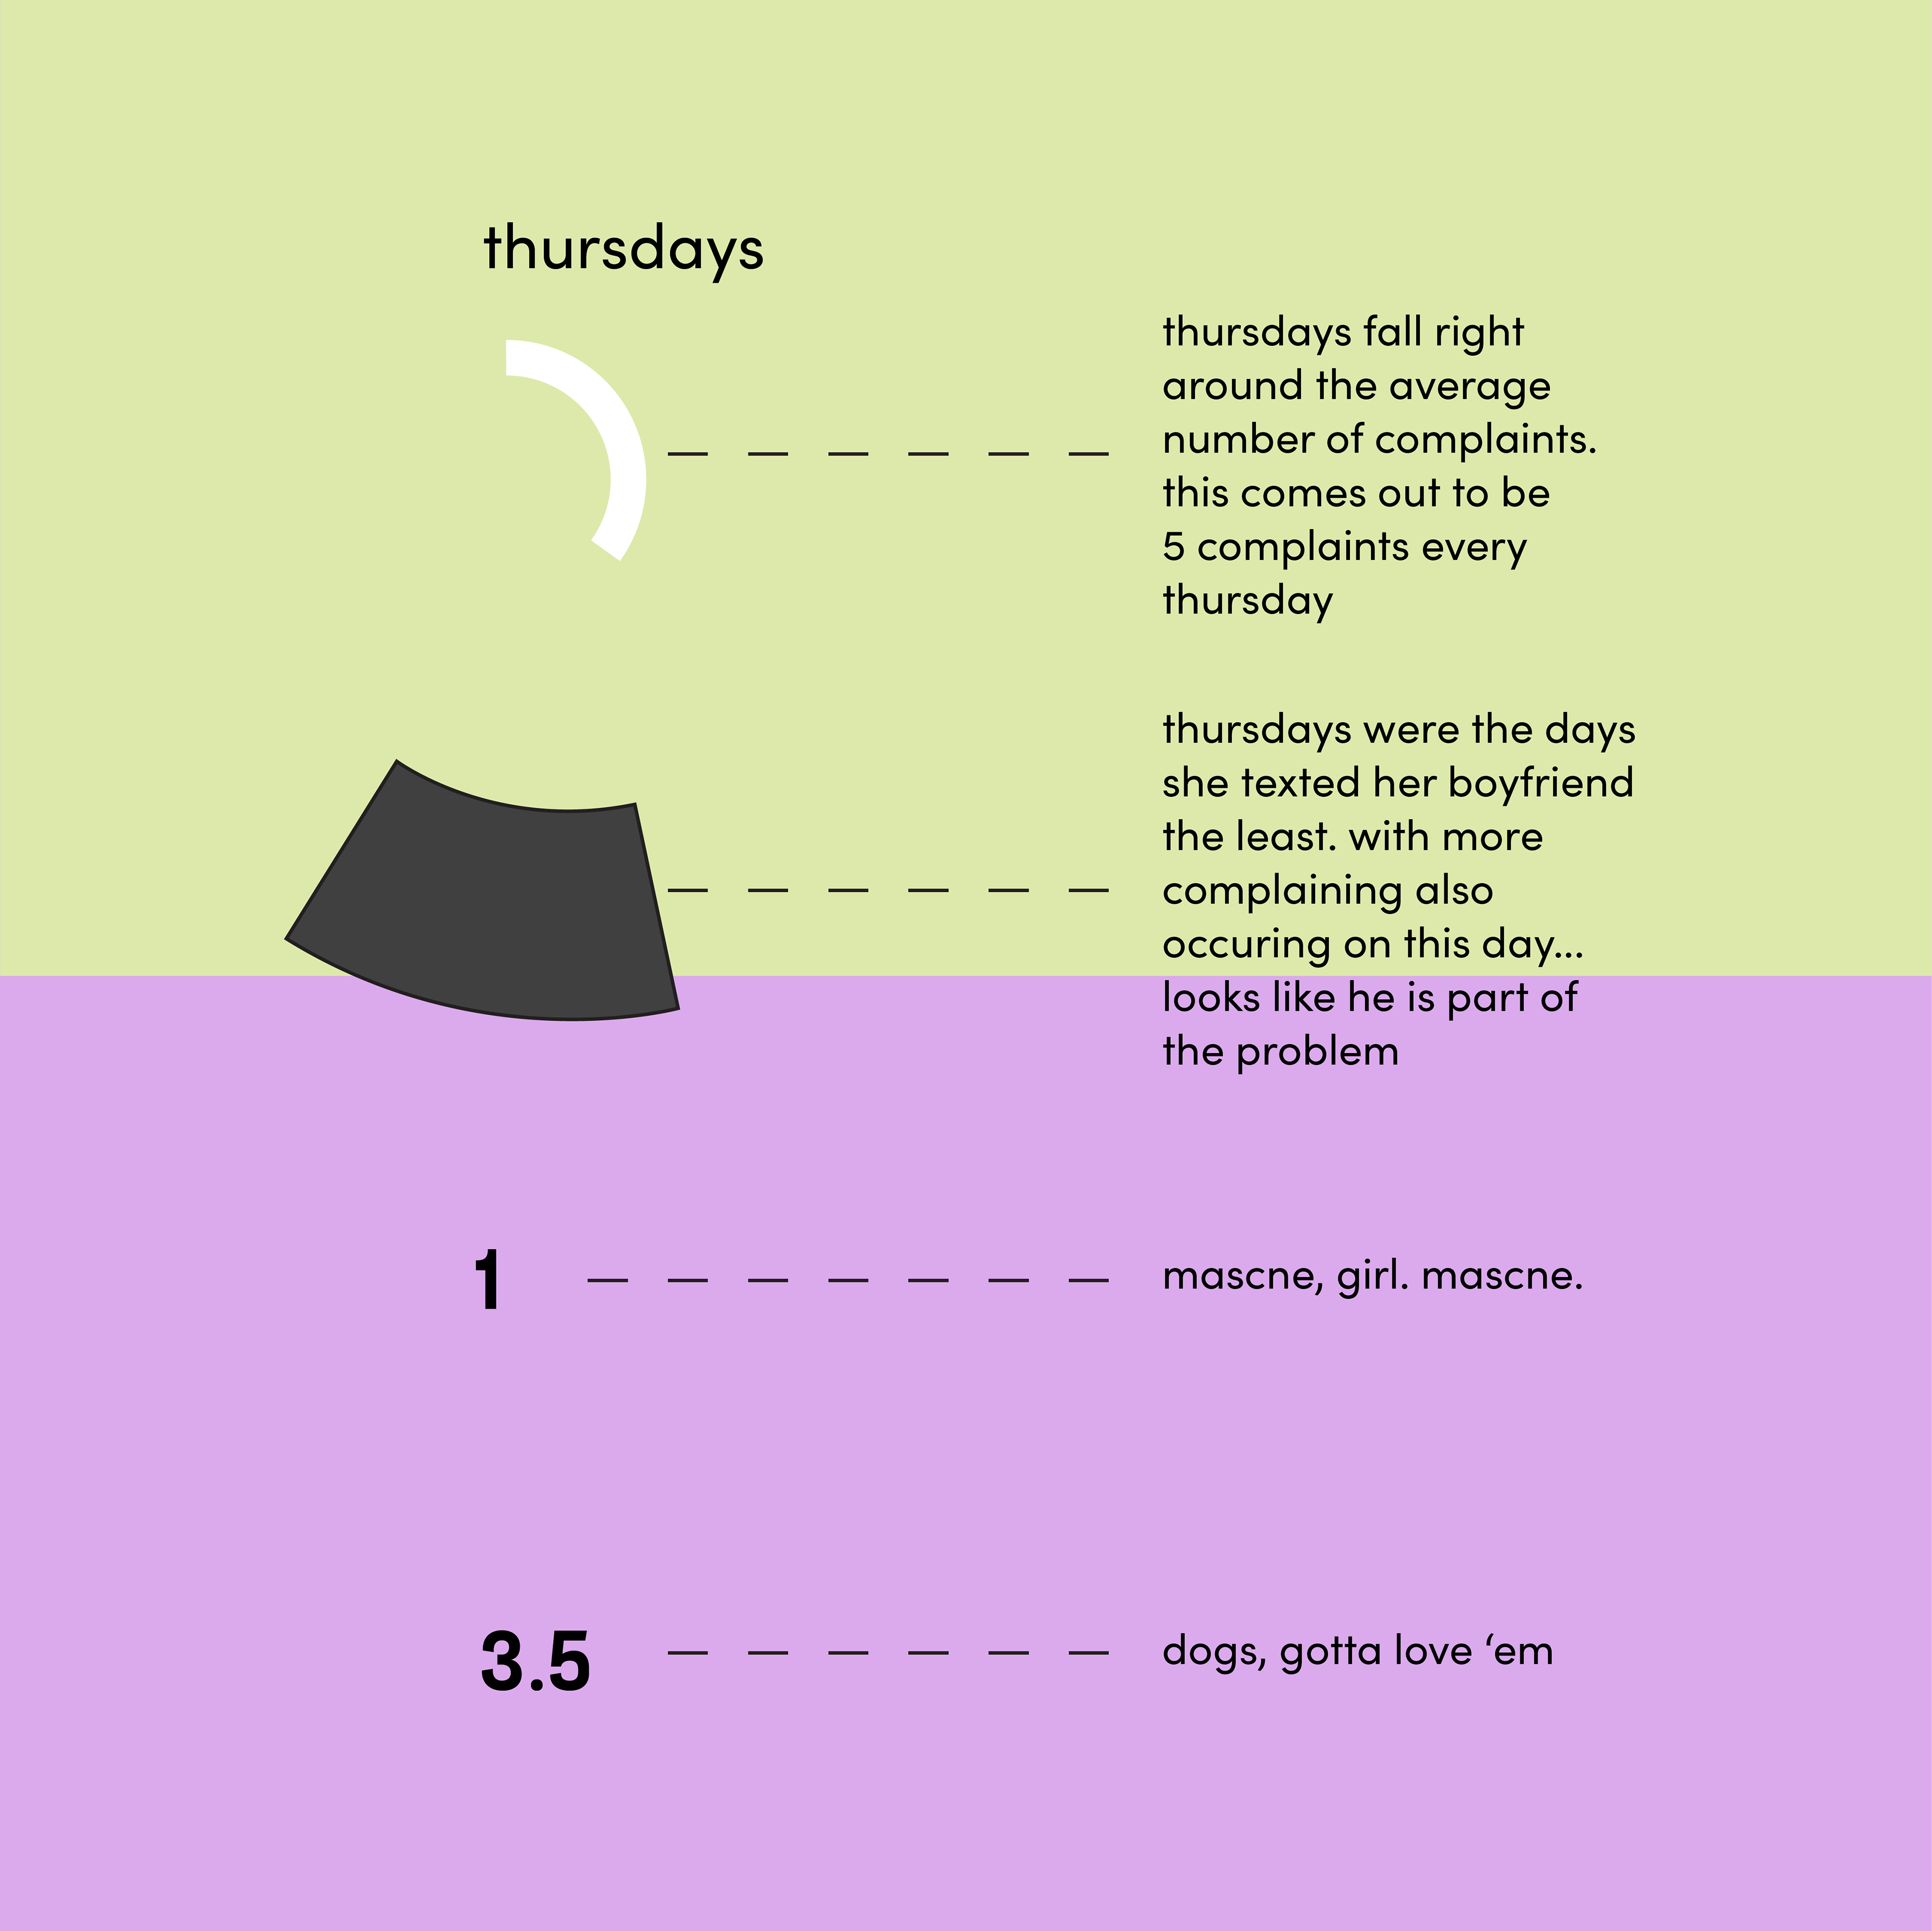
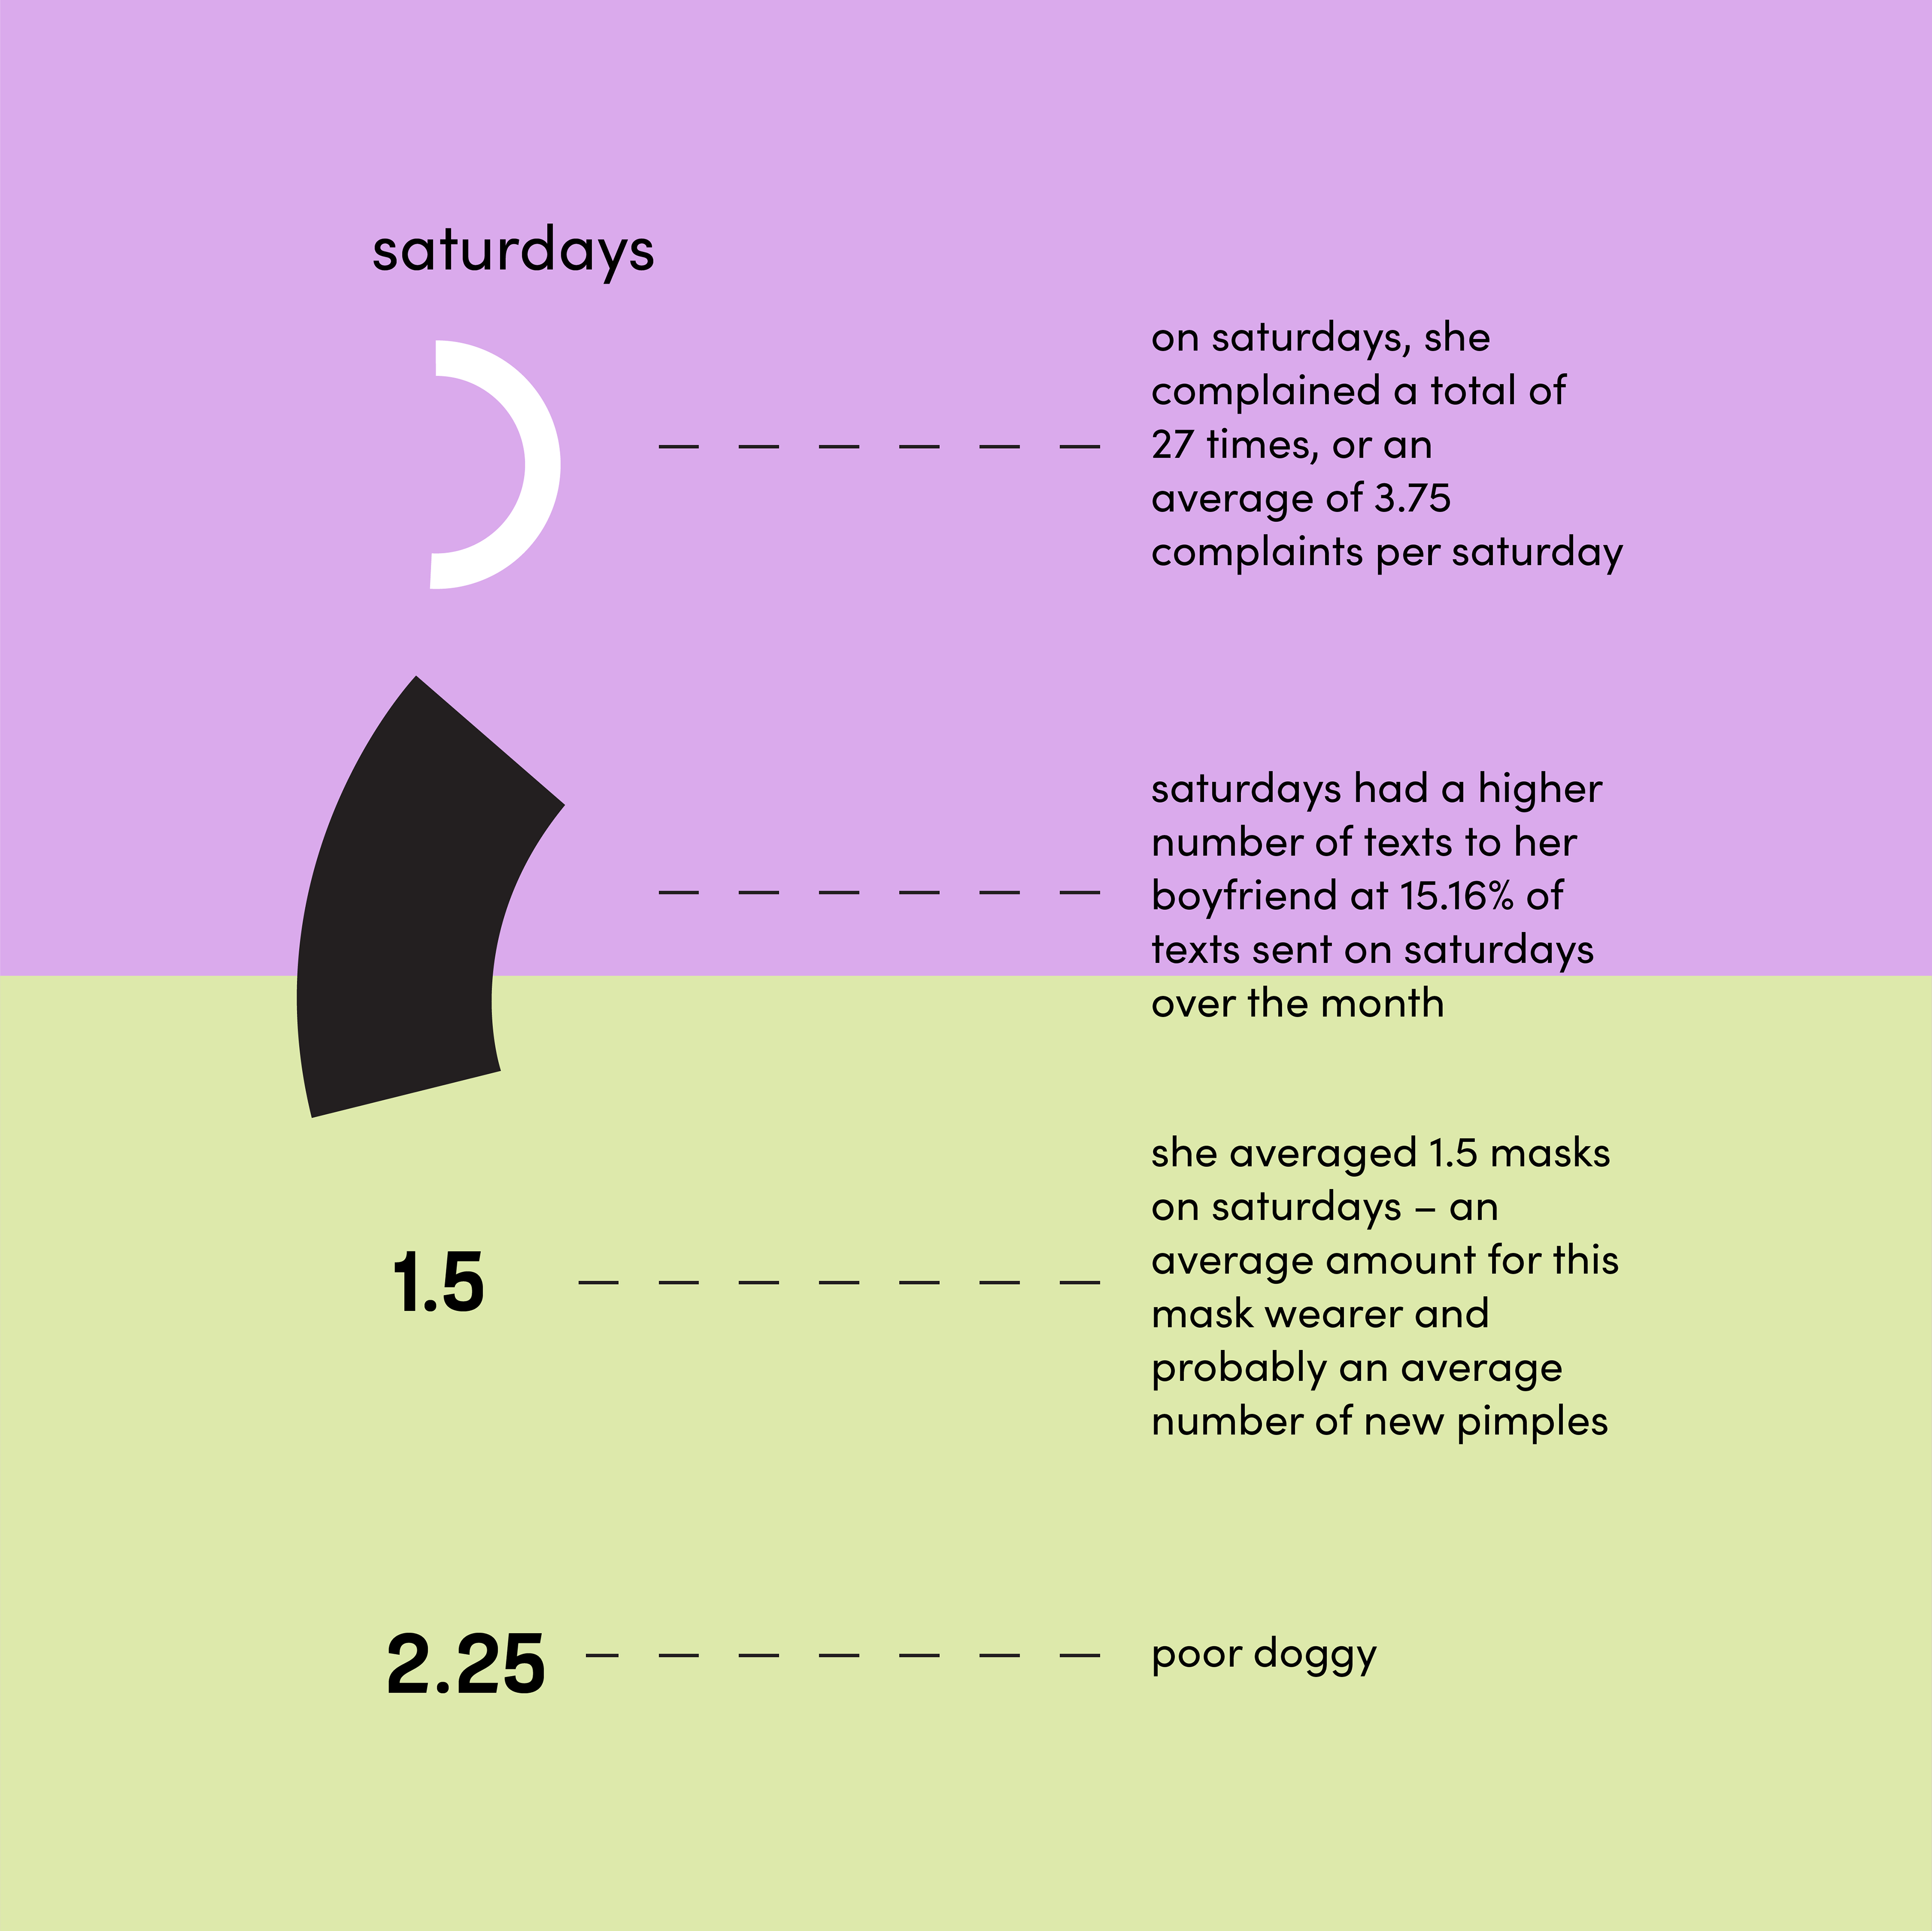
I began by putting the data into context. This is a valid step to take, as the context surrounding data can contribute to the story as much as the data itself. I considered the current global environment. Many are undergoing isolation and increased stress due to the COVID-19 pandemic. This external information supports the data and the argument that there is a lot more to complain about. The data is taken from the number of times a dog is let out in a day, the number of masks worn in a day, the number of texts exchanged with a boyfriend in a day, and the number of verbal complaints made in a day, all over the course of a month.
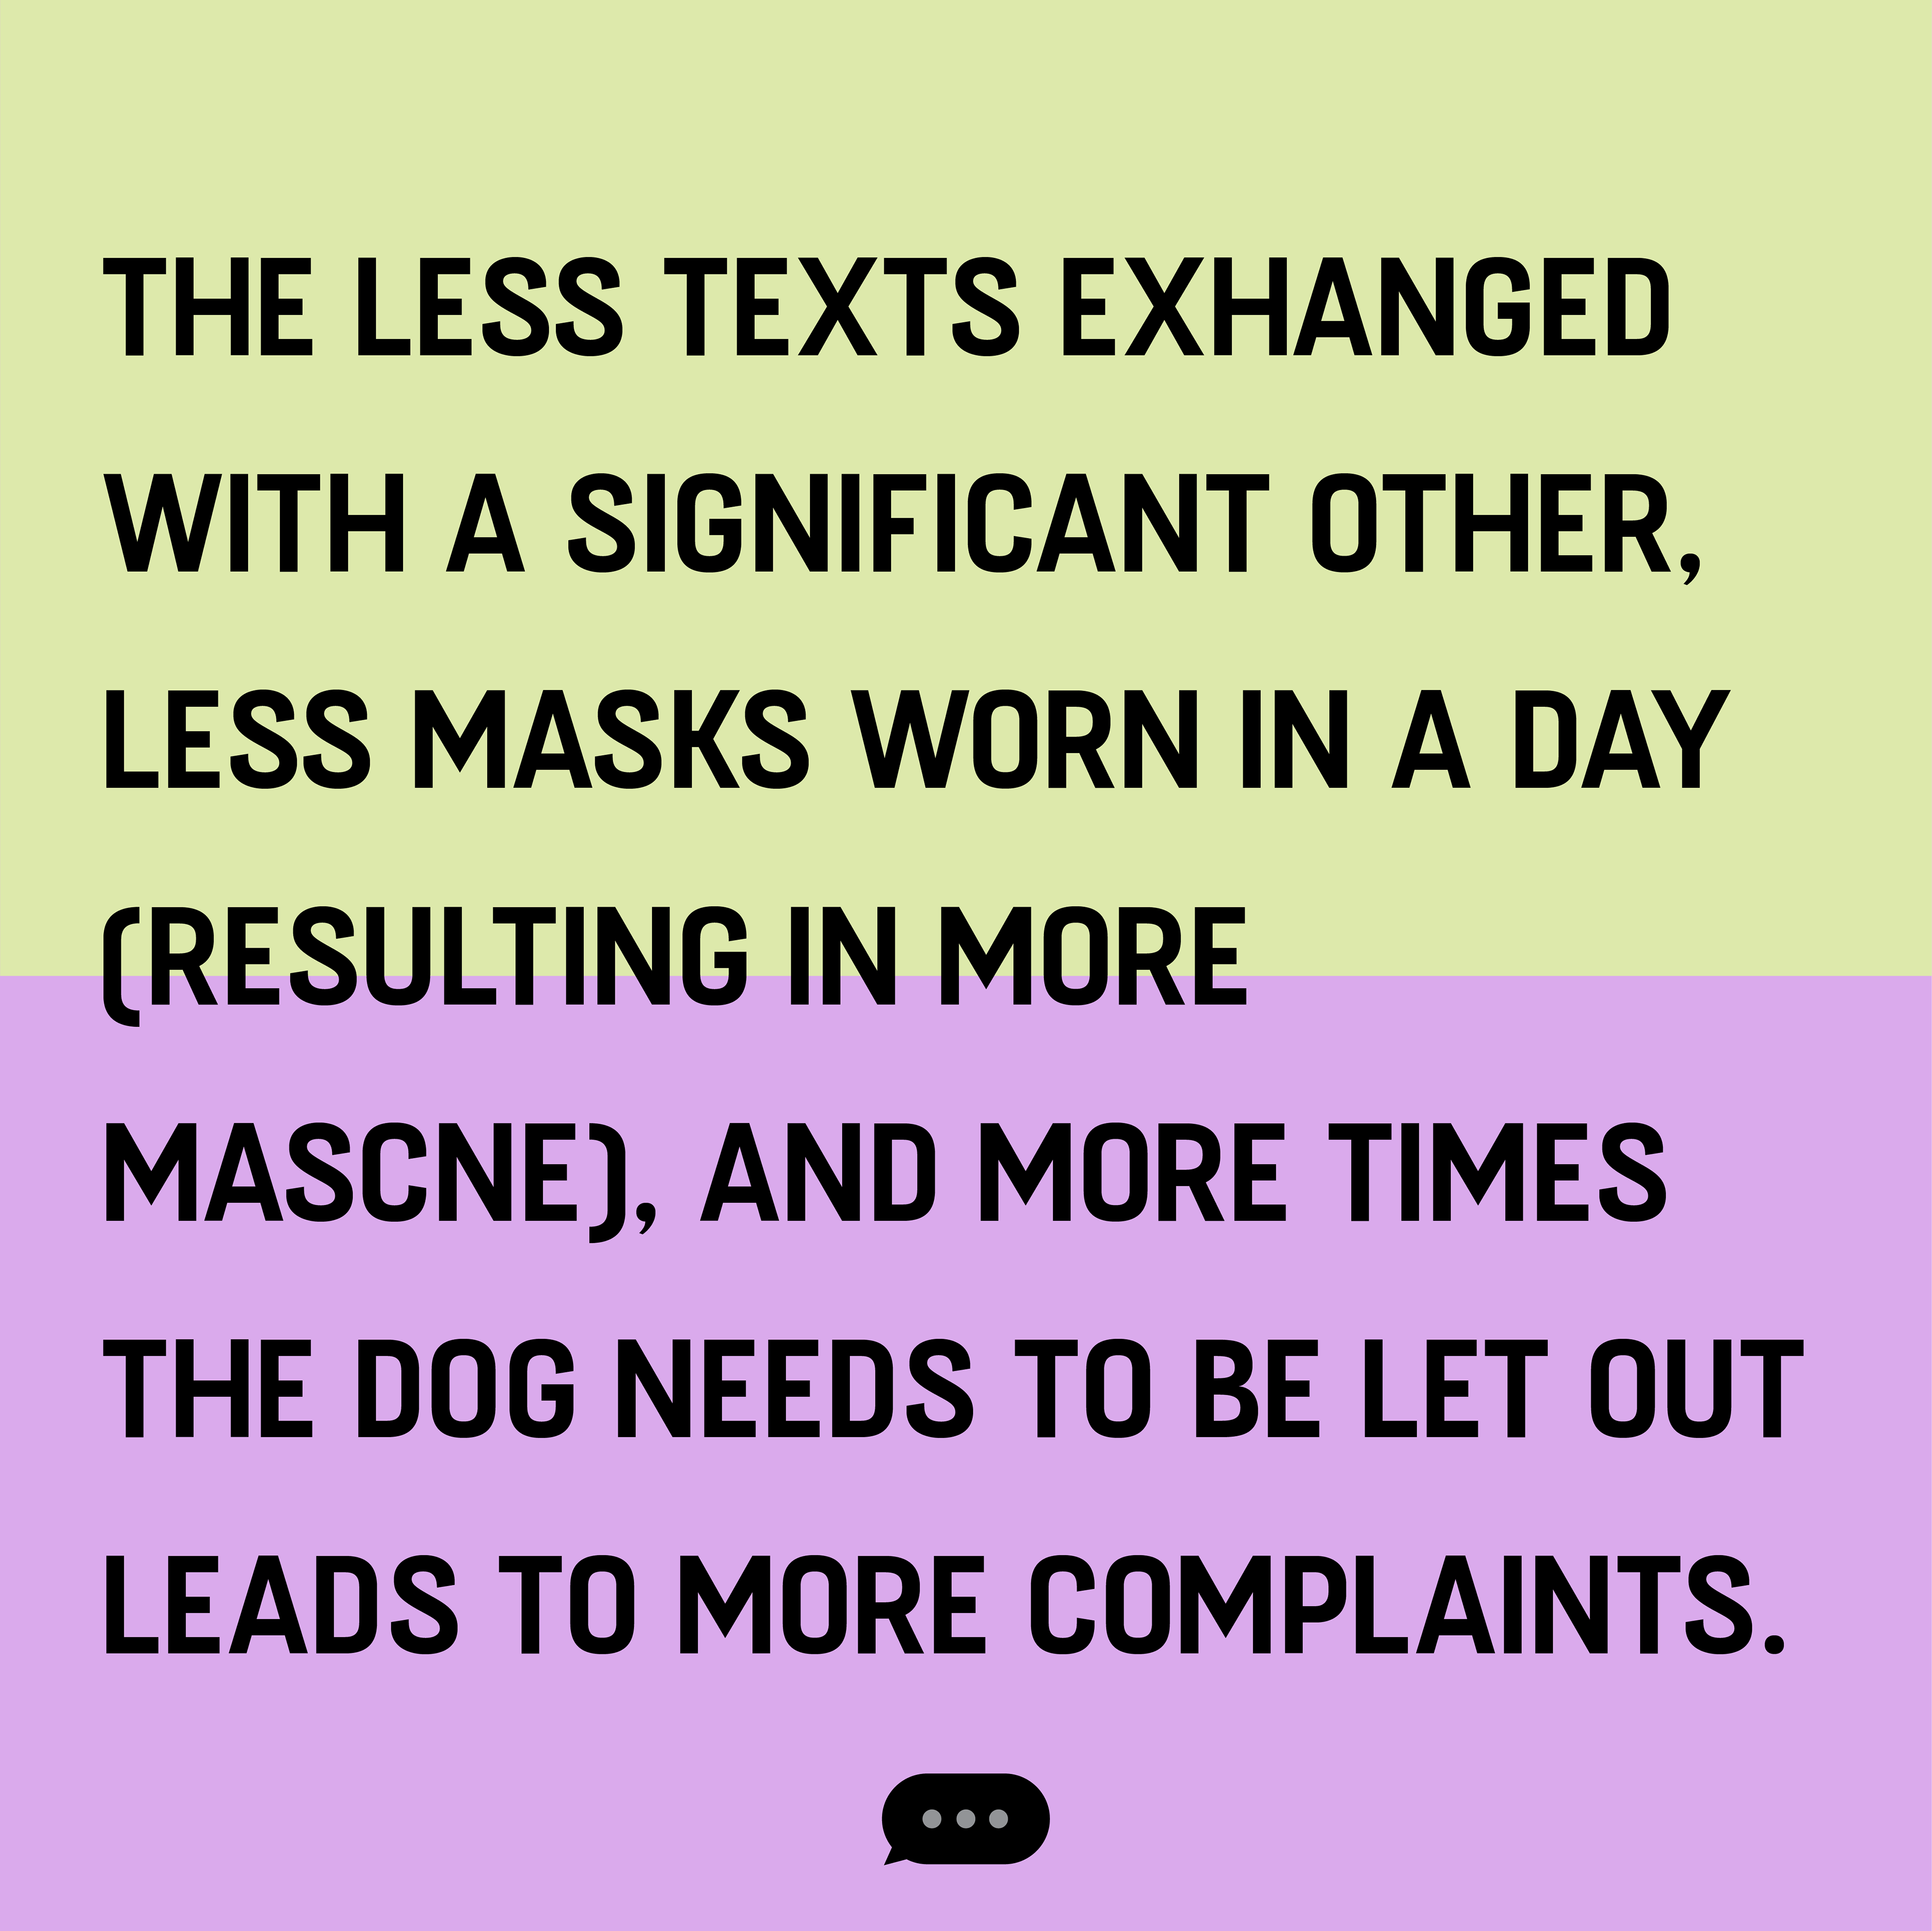
I was given this data anonymously, with only the information that someone in my class was the source. I was able to assume that the age range was 21-23 and, since there are a limited number of people in my class with a boyfriend who all happen to be female, I could assume the owner of the data was also female. Knowing this much, I made the blanketed statement that the less texts exchanged with a significant other, less masks worn in a day (resulting in more “mascne"), and more times the dog needs to be let out led to more complaints. The way this statement was made, the data its “results” were applied to all people regardless of their gender or age.
By strategically pairing and visualizing the data, I was able to manipulate these numbers to make a general argument about complaining. I took the averages of the data based off of the day of the week. This weakened the data and generalized it more so that there was a better correlation between the action (letting the dog out, wearing a mask, texting a significant other) and the result (number of verbal complaints). One thing the data neglected to cover was the content of the complaints. This would have added qualitative data to the set, but in the initial count, it is unclear whether six verbal complaints means six different times complaints were made or whether one count consisted of multiple complaints in the same dialogue. The lack of clarity within the data adds to the generalized nature of the argument.
It’s not surprising that on their own, actions like letting the dog out, wearing a mask, and a relationship are common things to complain about. The argument is not unrealistic, but the manipulation of this data is still misleading and shows that data can be twisted to make a point. The next time you are looking at data, make sure to acknowledge that data is biased and can be falsified and manipulated to make any argument.